Osmotic Gradient Ektacytometry
Test Explanation and Interpretation Guide
Osmotic gradient ektacytometry measures RBC deformability under a defined shear stress as a function of suspending medium osmolality. The test is used to evaluate for inherited RBC membrane disorders, which are commonly responsible for hemolytic anemia, differentiating among hereditary spherocytosis (HS), hereditary elliptocytosis (HE) and pyropoikilocytosis (HPP), Southeast Asian ovalocytosis (SAO) and hereditary stomatocytosis (HSt).
 Ektacytometry is recommended as the next step after hemoglobin electrophoresis in the diagnosis of a non-immune hemolytic anemia. An abnormal ektacytometry profile confirms a red cell membrane disorder and assists with the differential diagnosis between hereditary spherocytosis versus elliptocytosis / pyropoikilocytosis versus xerocytosis. This is particularly important in xerocytosis where splenectomy is contraindicated because it precipitously increases the risk for life-threatening thrombophilia. Ektacytometry in a patient with a non-transfusion dependent hemolytic anemia may save the need to perform a hereditary hemolytic anemia genetic panel. It can also help focus the genetic workup to a red cell membrane panel if ektacytometry is positive or to a red cell enzyme panel if ektacytometry is negative.
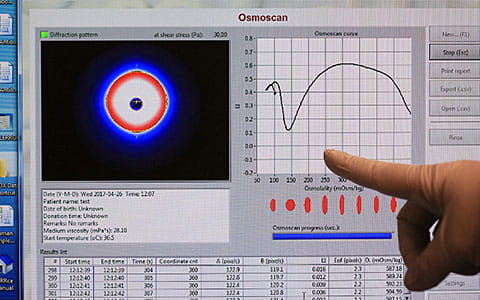
The test is performed using the Osmoscan LoRRca MaxSis (Mechatronics Instruments BV, Zwaag, The Netherlands). Three distinct features of the osmotic gradient ektacytometry profiles are:
- Omin: Corresponds to the value of the hypotonic osmolality where 50 percent of the cells hemolyze in an osmotic fragility assay and provides information on the initial surface-to-volume ratio of the cell sample.
- EImax: Elongation index reaches a maximum near 300 mOsm/kg, suggesting that the normal red cell deforms optimally at the tonicity to which it is normally exposed. The value of EImax depends mostly on the cytoskeleton mechanics.
- Ohyp: The declining portion of the curve (the osmolality value where the cells are at half of the maximum elongation) correlates with the initial MCHC (intracellular viscosity) of the cell sample (see Figure 1).
The ektacytometry patient report contains an ektacytometry profile (patient versus a normal control), the Omin, EImax and Ohyp values and an interpretation.
Examples of RBC membrane disorders detected by Ektacytometry can be seen in Figure 2.

Figure 1: The Ektacytometry Curve.
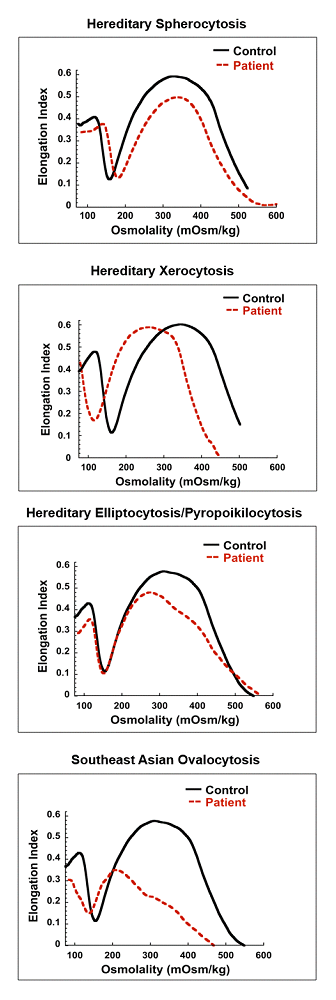
Figure 2. Examples of red blood cell membrane disorders detected by ektacytometry.


